Here’s an odd thing. Airbnb has a new program in Vancouver, offering $250 cash bonus for first-time hosts. It’s odd for two reasons. First, the company has been under pressure for exacerbating the city’s housing affordability crisis (Vancouver’s housing market is the most expensive in North America), so this looks like asking for more trouble. Second, Airbnb in Vancouver is already going gangbusters, so why does Airbnb feel the need to pay out to attract new hosts?
Here is a chart that shows what I mean by “gangbusters”. The y axis is the total reviews per month for a set of North American cities, with Vancouver picked out in bold red. The total number of visits is probably about one-and-a-half times this number, so it’s a measure of overall Airbnb traffic in the city. You can see there is a seasonal trend, with traffic dropping off over winter and picking up again in summer, but it’s pretty clear that this summer’s peak is well above last summer for most of these cities. Vancouver is now running at well over twice the volume of last year. (Click to expand, and hit the back button to return to the post)
 But there’s another way of looking at this growth. Vancouver is again highlighted in bold red in the chart below, which unpacks the overall traffic shown above. The x axis is the number of listings in the city, and the y axis is the average occupancy rate measured as the number of reviews per month per listing. Multiply them together and you get the total traffic for the city.
For most cities the trend is to more listings, with the occupancy rate going through the same seasonal trend we saw up above. (Although Philadelphia and Chicago are not doing so great, and San Francisco (the curly green line) seems to have hit a limit of listings, probably because of the drastic action Airbnb is taking to legitimize itself in that city. But that’s another story.)
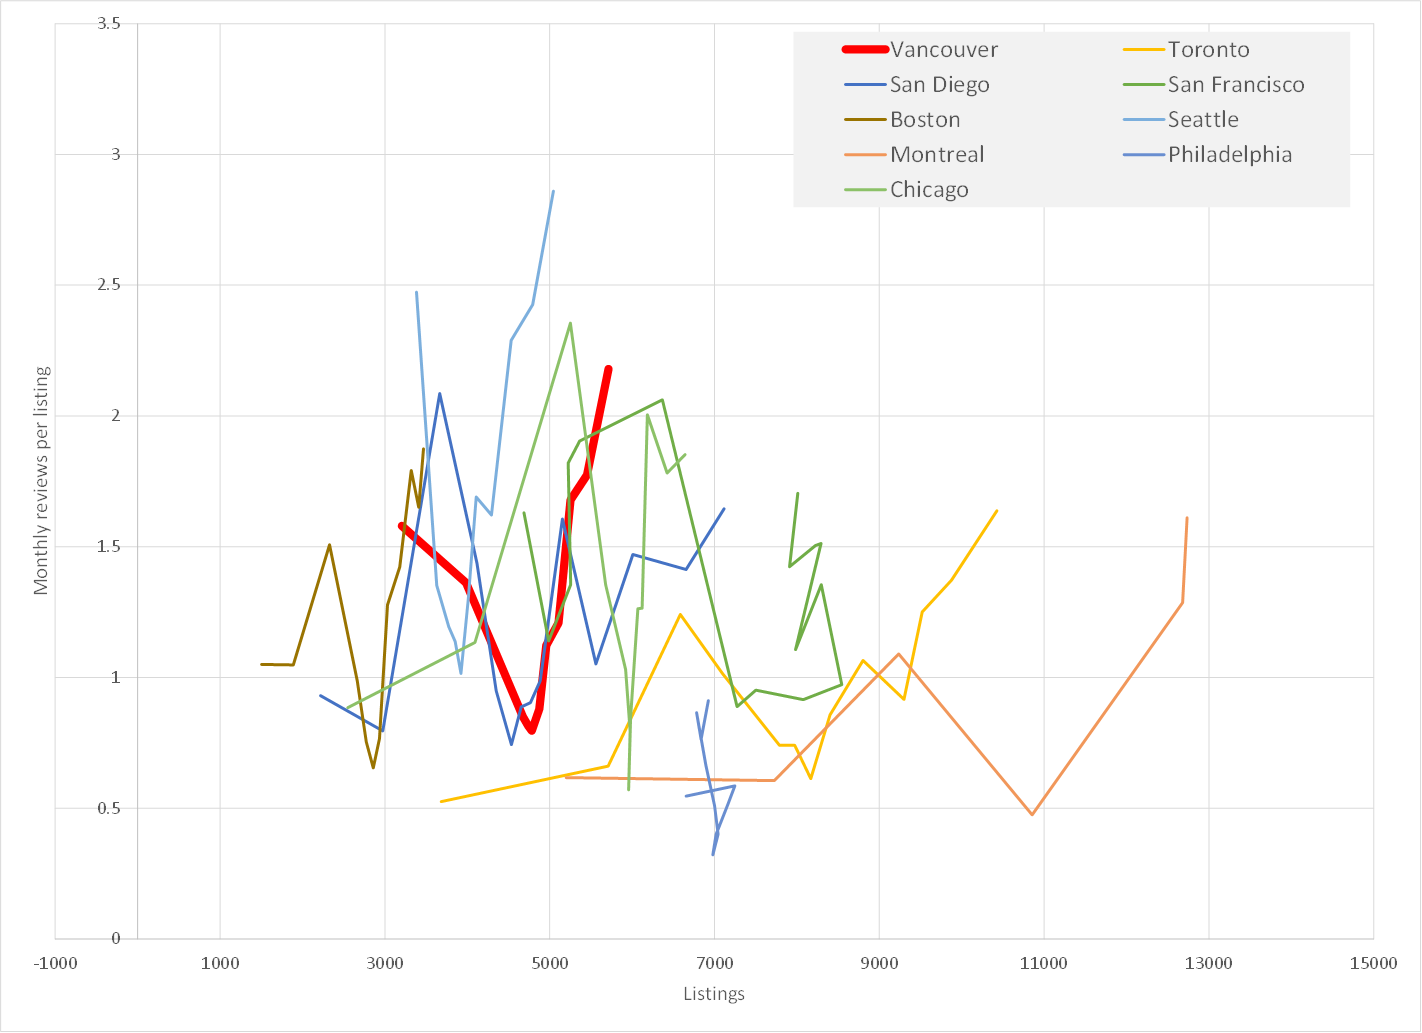
An increase in traffic can come about two ways: more listings, or higher occupancy, and there’s a bit of a trade-off between the two. So Toronto and Montreal (yellow and brown) have seen a rapid growth in the number of listings and the occupancy rate has grown significantly, but not massively. Meanwhile Vancouver has not seen such a rapid growth in the number of listings, but the occupancy rate is growing like topsy.
Now if a hotel was counted as a single listing it would be way to the top left of this chart, while Airbnb wants to claim that its hosts are only occasionally renting out the place in which they live — which translates into the bottom right. The fact that Vancouver listings are getting used more often could be bad news for Airbnb in its battle for legitimacy, so if it can attract more hosts they may take up some of the slack and move the line out to the right and down a bit.
To step back a bit, you do have to wonder if “bottom right” or “top left” makes much of a difference from the actual affordability and neighbourhood impact perspective. If you live in an apartment building and every other person rents out their place once a month, that’s the same impact in terms of traffic, extra utilities and the other things people complain about than a small number of people renting out their places all the time. And thousands of tourists staying in a small neighbourhood will have a similar impact (good and bad) in some ways if they are scattered across many listings or huddled together in a few. And what about the impact on house prices in high-traffic hotspots? It’s not obvious to me that a large number of low-occupancy listings has less of an impact than a small number of high-occupancy listings, though I could be convinced either way.
Anyway, I feel pretty confident that Airbnb is making its offer to offset the bad image that goes with the high-occupancy rates that Vancouver is now experiencing. And if there’s an offer for Seattle hosts, well that will confirm my suspicions.
Update: Thanks to Caroline O’Donovan for pointing me to this: an Airbnb host promotion in Seattle. Suspicions confirmed!


Tom,
I have a visual data representation suggestion. Using colors rather than tick marks is a good idea, as there are so many data series you are comparing. However, you should use more starkly different colors to designate the cities in your charts. The first chart isn’t too bad, with two shades of green. The second chart has three shades of blue, which are impossible for me to distinguish from each other.
There is a HUGE difference in Airbnb activity between US and Canadian cities! Even in colder months, Toronto and Montreal had many more reviews per listing than US cities. (This assumes that reviews per listing is an accurate proxy for Airbnb usage volume. For example, a sizable number of Airbnb “hosts” actually are commercial enterprises, and list hostel-type accommodations, in violation of housing laws. I am not sure how or if that impacts the reviews per listing data.) Anyway, I didn’t realize that Airbnb seems to be more popular in Canada than in the USA. Canada has tighter regulations than the USA in general, and Canada is less geographically popular as a travel destination. Is there another reason for Airbnb’s greater volume in Canada versus the USA?
Thanks for the suggestions. I should definitely spend some more time on the charts.
I’m not sure about the US/Canada difference. It’s true that Vancouver, Toronto, and Montreal are all growing fast, and that some US cities (Chicago and Philadelphia) not so much. But I think I’d want to control — for what, population? overall tourist traffic? — before making a real commitment.
I had a few more thoughts about residential real-estate in Vancouver. Vancouver is one of the most highly concentrated targets of Chinese capital flight, see here for details http://www.chinalawblog.com/2016/03/getting-money-out-of-china-the-reality-has-changed.html This has been a trend for the last ten years though, so I don’t know why it would impact Airbnb bonus rates for hosts now. What changed? China has been clamping down on capital transfers overseas due to its own recent economic woes in the past six months, but that shouldn’t have an immediate effect on availability in the Vancouver housing market.
Due to the high rate of Vancouver home ownership by non-Canadian nationals or non-residents (e.g. Chinese high net-worth individuals and business investors), the vacancy rate of Vancouver homes is very high. I don’t know if Airbnb is able to exploit that unusual situation or not, as the the absentee owners may prefer to leave their homes unoccupied given that their motivation for ownership is capital flight from China to North America.
There is certainly a lot of unethical behavior in the Vancouver housing market, e.g. “Former wholesaler reveals hidden dark side of Vancouver’s red-hot real estate market” http://news.nationalpost.com/news/canada/were-not-realtors-former-wholesaler-reveals-hidden-dark-side-of-vancouvers-red-hot-real-estate-market
I’ve followed the Vancouver housing market only slightly, being dragged into it by the Airbnb thing. It’s clearly a complicated thing with many factors, and Airbnb is just one of many. When I’ve been asked, I’ve always said that Airbnb is making it a bit worse, and is not helping the problem. Your thought about absentee owners is interesting. I think Karen Sawatsky has a lot of insight into the Vancouver-specific issues: https://shorttermconsequences.wordpress.com.
Similar situation in Dublin. Airbnb encouraging hosts to recruit with new hosts with payback on intro and subsequent bookings.
Airbnb would be cited as a factor in the shortage of rental property for long term rental and the now very expensive rental costs that are prohibitive for families and those working in the capital