Airbnb data collection: announcement

I’ve been doing the Airbnb data collection thing for about four years now, off and on, with my first post being on October 19, 2013.

It’s been interesting, rewarding, and useful for quite a few people, and I think it has helped to push the debate on Airbnb forward in some cases. But there is a time for every season and I think this effort has done what it can, and it’s time to move on. I’ll continue until the end of the year, and I’ll complete any commitments I have made to individuals and groups, but as of the end of the year I will stop running regular data collections.

A few notes / reasons:

  • I’ve already fallen behind on responding to requests, and I won’t be taking more.
  • My code is on github (https://github.com/tomslee/airbnb-data-collection) for anyone who wants to continue and the bulk of the data I have collected will remain at http://tomslee.net/airbnb-data-collection-get-the-data. It could be much better, but it’s there.
  • Others are doing a better job of making public data accessible (including the excellent Murray Cox at Inside Airbnb obviously).
  • People doing serious research tend to roll their own (it’s not rocket science) or go to commercial outfits like AirDNA who collect more detail.
  • Cities looking for a partner in managing short-term rentals may consider groups like Host Compliance https://hostcompliance.com.

Thanks for the feedback and contributions, and all the fascinating conversations I’ve had through this project. Onwards and upwards…

At the Boston Review: “Silicon Valley to Liberal Arts Majors: We Want You”

I have a book review / essay up at the Boston Review. Titled “Silicon Valley to Liberal Arts Majors: We Want You” it is a review of two books: The Fuzzy and the Techie: Why the Liberal Arts Will Rule the Digital World  by Scott Hartley and What Algorithms Want: Imagination in the Age of Computing by Ed Finn.

The beginning:

If you are a student of the liberal arts, is there a place for you in our increasingly-digital world? Not really, according to many. Bill Gates thinks your programs should be cut in favor of STEM subjects, his fellow tech-billionaire Vinod Khosla says “little of the material taught in liberal arts programs today is relevant to the future,” and Marc Andreesen says you will end up working in a shoe store. Maybe you should just learn to code.

Tech billionaires claim that fuzzies—students of the liberal arts and social sciences—are doomed to working in shoe stores, but two new books pin the future of tech on them.

Or maybe not. Two new books make a case that the technology industry can no longer be driven purely by software engineer hackers, and that you have a critical role to play in guiding it in more ethical and humane directions. That said, their authors differ dramatically about what that role is. Scott Hartley wants you to bring your skills and insights to the world of technology startups, to unlock the full potential of technological innovation. Ed Finn, on the other hand, seeks to hold the technology industry to account: he believes we need “more readers, more critics,” posing questions about who technology serves, and to what ends…

A few notes:

  • The essay benefited greatly from editing by Deb Chasman and Adam McGee.
  • It has been repeatedly tweeted by the account of the book “The Fuzzy and the Techie”. I can’t work out if they didn’t actually read it, or if they just think any publicity is good publicity, or if I was kinder on the book than I intended to be.
  • “Liberal Arts”. Is that purely an American thing now? I sometimes can’t tell any more. And sometimes it includes natural scientists, sometimes the meaning seems more narrow. At any rate, I wrote the review not really knowing precisely what it means.

Airbnb downloadable data sets

I’ve continued to collect data about listings in cities around the world from the Airbnb web site, and I’ve been posting maps based on them here.  Each map takes some manual work, so I have not uploaded all the data I’ve collected. But after many requests I’ve finally uploaded the basic data for all the 99 cities (and/or regions) I’ve surveyed, and they are available here. For some cities, it is just one survey, while for others there are (roughly) monthly surveys over a period of two years or more. Each download is a zip file that contains one or more comma-separated values (CSV) files that can be read into your generic spreadsheet program or other application of choice.

The code I use is posted on github here, and the method is described roughly here, although there are some changes over time. If you find mistakes or if you do find it useful, I would love to hear anything about how you use it.

On Orange Tyrants

A few months ago I read a couple of historical novels by Philippa Gregory, set in the reign of Henry VIII (The King’s Curse, and The Taming of the Queen). I thought I was reading for entertainment, but they have been the best guide to what to expect from Trump that I’ve come across.

Henry was a second son, not brought up to be king, and he was spoiled. He could not bear that anyone be better than him, at riding, at archery, at jousting, whatever.

So what Gregory’s books convey very well is how not to deal with a privileged and powerful narcissistic orange bully with no attention span. Henry could flatter and be generous, and the objects of his flattery would think they had influence. But when Henry’s needs or wants changed, or when anything went badly, these people were suddenly cast aside. His wives are the obvious examples, but counsellors and ambassadors and nobles too.

All of a sudden, they would hear that Henry was disappointed in them. That after years of friendship and loyalty, Henry was dismayed to find that they had let him down (because nothing, ever, was Henry’s fault). And then they would simply be frozen out, unable to reach him, refused entrance to court. And maybe they would lose their head. Thomas Wolsey, Thomas Cromwell: both had their moment, and then didn’t. (Maybe don’t be called “Thomas” or “Anne” either)

So when I see people saying that Trump understands them (the Canadian government, the technology leaders who paid court), that — in the words of the tech leaders — they will set him straight if he goes off-course, I think: you have no idea how this works. Of course he and his crew will flatter you, tell you how brilliant you are, how much he admires you. Until he doesn’t. Until he decides that you have disappointed him. And then you will hear about it second hand, or maybe through Twitter. You’re out, and the axe will fall, and you’re not so special after all.

Those “realist” commentators who say they can manage Trump (with a bit of flattery here, a few wise words there) need to read about Henry VIII to see how that story ends.

If that takes too long, they should at least follow @KngHnryVIII on Twitter, who set it out in August here. From which:

Let me put it this way, you know that feeling of anxiety and fearful remorse that can steal over you in the darkest hours of the night? I don’t have that. Neither does Trump.

Update: David Golumbia points out that Sean Spicer’s infamous first press conference may be an example. Told to deliver a stinging rebuke, he follows his master’s bidding. When the rebuke causes problems, Trump hangs him out to dry, saying maybe he went too far. That’s what you get for riding an orange tiger.

Looking back at my 2016: publications and media

Here is a reasonably complete collection of things written by me, interviews of me, book reviews about my book, and articles to which I contributed through interviews or quotes or data sets for the year 2016. It’s been a busy year, and rewarding in many ways.

Book

My second book What’s Yours is Mine: Against the Sharing Economy was published by OR Books in November 2015, but I am including the book and related articles here, making it a “long 2016”.

  • US and UK edition (link), OR Books, November 2015
  • Canadian edition (link), Between the Lines Press, February 2016
  • German edition (Deins ist Meins): Verlag Antje Kunstmann
  • Spanish edition: Lo tuyo es mío, Taurus, November 2016
  • Simplified Chinese edition: (Ginkgo Book Co.)
  • French language edition (France and Québec): Ce Qui est à Toi est à Moi, translated by Hélène Rioux, Lux Editeur

Book chapter

Invited Essays

Reviews of “What’s Yours is Mine”

Interviews

Quoted, and Airbnb data

Report: How Airbnb hid the facts in New York City

Together with Murray Cox of Inside Airbnb,  I produced a report on Airbnb’s removal of 1500 listings in New York, just in time to make its public release of data look good.

Events

Why is Airbnb offering a bonus for new hosts in Vancouver?

Here’s an odd thing. Airbnb has a new program in Vancouver, offering $250 cash bonus for first-time hosts. It’s odd for two reasons. First, the company has been under pressure for exacerbating the city’s housing affordability crisis (Vancouver’s housing market is the most expensive in North America), so this looks like asking for more trouble. Second, Airbnb in Vancouver is already going gangbusters, so why does Airbnb feel the need to pay out to attract new hosts?

Here is a chart that shows what I mean by “gangbusters”. The y axis is the total reviews per month for a set of North American cities, with Vancouver picked out in bold red. The total number of visits is probably about one-and-a-half times this number, so it’s a measure of overall Airbnb traffic in the city. You can see there is a seasonal trend, with traffic dropping off over winter and picking up again in summer, but it’s pretty clear that this summer’s peak is well above last summer for most of these cities. Vancouver is now running at well over twice the volume of last year. (Click to expand, and hit the back button to return to the post)

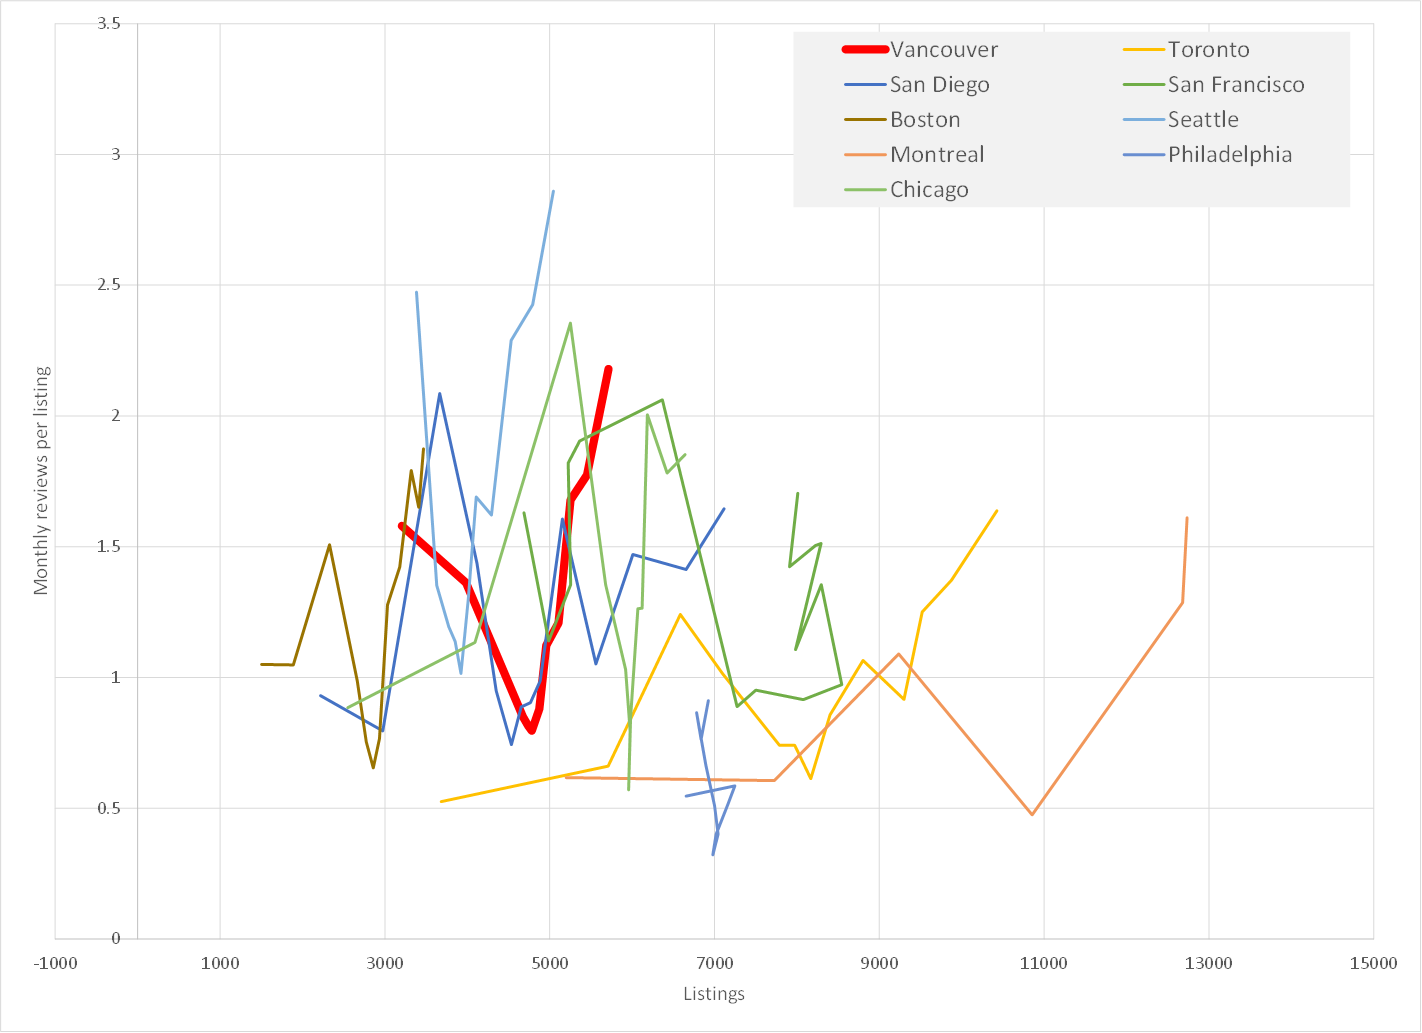
vancouver_1But there’s another way of looking at this growth. Vancouver is again highlighted in bold red in the chart below, which unpacks the overall traffic shown above. The x axis is the number of listings in the city, and the y axis is the average occupancy rate measured as the number of reviews per month per listing. Multiply them together and you get the total traffic for the city.

For most cities the trend is to more listings, with the occupancy rate going through the same seasonal trend we saw up above. (Although Philadelphia and Chicago are not doing so great, and San Francisco (the curly green line) seems to have hit a limit of listings, probably because of the drastic action Airbnb is taking to legitimize itself in that city. But that’s another story.)

vancouver_2

An increase in traffic can come about two ways: more listings, or higher occupancy, and there’s a bit of a trade-off between the two. So Toronto and Montreal (yellow and brown) have seen a rapid growth in the number of listings and the occupancy rate has grown significantly, but not massively. Meanwhile Vancouver has not seen such a rapid growth in the number of listings, but the occupancy rate is growing like topsy.

Now if a hotel was counted as a single listing it would be way to the top left of this chart, while Airbnb wants to claim that its hosts are only occasionally renting out the place in which they live — which translates into the bottom right. The fact that Vancouver listings are getting used more often could be bad news for Airbnb in its battle for legitimacy, so if it can attract more hosts they may take up some of the slack and move the line out to the right and down a bit.

To step back a bit, you do have to wonder if “bottom right” or “top left” makes much of a difference from the actual affordability and neighbourhood impact perspective. If you live in an apartment building and every other person rents out their place once a month, that’s the same impact in terms of traffic, extra utilities and the other things people complain about than a small number of people renting out their places all the time. And thousands of tourists staying in a small neighbourhood will have a similar impact (good and bad) in some ways if they are scattered across many listings or huddled together in a few. And what about the impact on house prices in high-traffic hotspots? It’s not obvious to me that a large number of low-occupancy listings has less of an impact than a small number of high-occupancy listings, though I could be convinced either way.

Anyway, I feel pretty confident that Airbnb is making its offer to offset the bad image that goes with the high-occupancy rates that Vancouver is now experiencing. And if there’s an offer for Seattle hosts, well that will confirm my suspicions.

Update: Thanks to Caroline O’Donovan for pointing me to this: an Airbnb host promotion in Seattle. Suspicions confirmed!

Airbnb in Lisbon: a few corrections

Airbnb just posted one of its charming city reports providing an Overview of The Airbnb Community in Lisbon and Portugal. The summary is here and the full report is here. At the prompting of some Lisbon urban geographers and activists concerned about the damage Airbnb is doing to the historic centre of their city, I’ve done some surveys of Lisbon.

The Airbnb report, as usual, presents some concrete figures, leaves out some other figures, and also presents a lot of figures that are not very interesting at all. It does so with the company’s traditional absence of supporting data or methods. Let’s look at a few of the most important.

Airbnb: “More than 4,500 hosts shared their space on Airbnb last year”

My results: Between May 2015 and May 2016,  I identify 4633 separate hosts who have properties with reviews. There are over 6000 separate hosts with listings on the site. The Airbnb statement confirms the data I have collected.

Airbnb: 72 percent of hosts in Lisbon have only one listing and hosts have lived in the city for an average of 25 years

My results: In my most recent survey, 71% of hosts have only one listing, confirming Airbnb’s statement.

What Airbnb doesn’t say: 65% of listings in Lisbon belong to hosts with multiple listings. The majority of listings in Lisbon do not belong to regular folks who use the site only to occasionally rent out the home in which they live. The number of “multiple listing” hosts is growing even faster than the overall number of listings. The total number of listings almost doubled between May 2015 (5600) to June 2016 (over 10,000), and the percentage of listings belonging to multiple-listing hosts has grown from 59% of the total to 65% of the total. To me, this “percent of hosts with only one listing” is always the most deceptive of Airbnb’s phrasings, and in the case of Lisbon it is particularly misleading.

Airbnb: A typical listing in Lisbon is shared for 76 nights a year and more than half of all listings in Lisbon are rented for fewer than 90 days.

My results: I don’t have reliable occupancy data, but this claim also is noticeable for what it doesn’t say. There are about 2,000 Lisbon listings with no reviews at all: clearly a host with no guests causes no problems and makes no money, but using a median value (the “typical” listing) gives each of these listings equal weight. What is of interest is those at the top end: and of course there is not much said here. We can infer that almost half are rented for more than 3 months in the year, but we don’t know the concentration at the top end.

What we do know is that the areas with most listings (Santa Maria Maior and Misericordia) have a disproportionate share of the business. Between them, they have about 40% of the listings but well over half of the visits, and (with prices there being more expensive) an even bigger share of the revenue. You can get a better idea of what this means by looking at the maps here (taken from my listings page), and download a full set of listings with each one:

Airbnb’s continued presentation of partial and biased “data” about its activities in cities around the world shows their lack of interest in accountability and, ultimately, their lack of interest in the cities where they operate.