Summary
This document is for people who want to use any of the Airbnb city data that I have collected since November 2013. It describes how the data is collected, and looks at the completeness and accuracy of the data, and notes some areas for improvement. The source code is available at Github.
In this document, a “survey” is an automated collection of data from the Airbnb web site for a specified city (“search area”) on or around a specific date. The survey may take between one and three days, depending on the number of listings in the city.
There have been significant changes to how I do the collection since July 2015: this document reflects those changes.
The main conclusions are:
- The data collection gives a count of Airbnb listings in a city that is usually within 10% of the correct number. This level of accuracy provides a solid foundation for most policy and social impact discussions. If listings are missed, it is probably because they are fully booked for the near future.
- Within that count, listing type (“Entire home/apt”, “Private room”, or “Shared room”) and host statistics (number of listings per host) are reported unambiguously, and so provide solid foundation for discussion. One caveat is that some hosts may create multiple identities (“sockpuppets”), and list themselves as such on the site.
- The data collection includes latitude and longitude values for each listing. Street addresses of individual listings cannot be reliably inferred from these values. Combined with municipal geographical maps (eg, ESRI shapefiles of neighborhood boundaries), the data can be used to analyze listings by neighborhood within a city.
- Price data is collected in $US. The value is usually per night and aggregated pricing information is therefore reliable.
- Estimates of the proportions of listings and of revenue can be made, based using the number of reviews as a proxy for the relative number of visits, and the nightly price as a proxy for the relative income. Comparison with published data from Berlin shows that these estimates are good enough to be useful in policy and social impact discussions.
Methodology
This section describes how a survey of an individual search area is carried out.
- Source code
The source code is available at Github.
The source code is in python 3. It scrapes data from the Airbnb web site for a city (labelled a search area) , and stores the result in a database. Each collection of a single city is called a survey. A single database holds many separate surveys, including some of the same city.
The database system used is now PostgreSQL.
Most of the python modules used are standard or are easily installed using one of the python package management systems. An exception is the lxml package, which can be tricky to install and is available from here. For Linux and Mac users the system package manager can be used.
- Data collection outline
The outline is now provided at http://github.com/tomslee/airbnb-data-collection.
- Data collected for each listing
The script parses the data on that page to collect the following data:
- host_id
- Each Airbnb host has a unique host_id value.
- room_type
- One of the three room types listed above.
- country
- For example, “United States” or “Italy”
- city
- As entered in the page. This value may not match the search_area. For example, many listings have Brooklyn as the city even though they appear in the New York search_area. The city field is not used much in any analysis.
- neighborhood
- This value may not match the neighborhood in the search, as search results commonly include listings from other neighborhoods. It is difficult to extract reliably from the Airbnb pages, and should not be taken too seriously.
- address
- The street address (which generally does not include a street number) is also difficult to extract reliably from the web page, as it is entered by the host. It should not be taken too seriously.
- reviews
- The number of reviews for the listing. Unfortunately, the individual reviews are not collected.
- overall_satisfaction
- For listings that have at least three reviews, this is the overall satisfaction (on a one-to-five star rating, including half-stars). Individual ratings (eg cleanliness) are not collected.
- accommodates
- The number of people that the listing accommodates, according to the host.
- bedrooms
- If listed, the number of bedrooms.
- bathrooms
- If listed, the number of bathrooms.
- price
- The price listed by the host. This is almost always the price per night, but there are listings for which it is a price per week. Unfortunately, the script does not make this distinction. The price is collected in the currency displayed on the web page, which depends on the location from which the search is carried out. All my surveys record prices in $Cdn, for example.
- deleted
- If the page does not appear, it is marked as deleted by entering a 1 in this column.
- minstay
- The minimum number of nights that the listing is available for, according to the host.
- last_modified
- A timestamp recording when the script collected the data.
- latitude
- The latitude, as listed in the web page source.
- longitude
- The longitude, as listed in the web page source. For individual listings it is not clear that these values are always accurate. In general, however, they are close to the listing location.
- survey_id
- The survey being recorded. A single room may be visited several times in repeat surveys.
- Unavailable data
Among the data that is not included in the surveys is:
- occupancy rates: no occupancy data is collected.
- host income: without occupancy rates, host income is not available.
- specific addresses: exploration with available reverse geocoding databases suggests that the latitude and longitude values do not map reliably to specific addresses.
- guest information: no guest information is collected.
Rough income and occupancy distributions can be estimated from the data, as described below, but these estimates are of relative values, not absolute.
Listing completeness
This section demonstrates that the total number of listings in a city is accurate to within 10% or 20% most of the time. Airbnb rarely releases raw data, so that accuracy can only be assessed by comparison to other studies or to occasional public statements from Airbnb. One exception is the Attorney General’s report on New York, which is based on Airbnb internal data.
The search methodology does not enter “trip dates” in any of the searches, so that the web site does not exclude listings that are marked as unavailable. However, we know from individual cases that some listings (eg, ones that are heavily booked, or otherwise not available) are not found in the search.1 For this reason, the script has been updated to also visit room_id values from previous listings, in case the search missed them.
Boundaries are another source of uncertainty. A search in many major cities returns nearby listings that may not be within the city boundaries. Searches in “San Francisco”, for example, return results in Oakland and throughout the greater metropolitan area.
The availability of latitude and longitude values means that, if geo-spatial data is available from an individual city, more precise numbers can be reported (SQL Anywhere includes the ability to import ESRI shape files, commonly available on government open data web sites, and to carry out geo-spatial queries). For a few purposes, and for a few cities, such queries have been carried out. It is, however, a labour intensive process as each city makes neighborhood available in its own way.
All listings found in any survey do exist on the Airbnb site. There is evidence from Airbnb statements that the listings are fairly complete. Here are some statements made by Airbnb or by others who have access to internal Airbnb data, and some notes.
- New York: Attorney General’s Report
At the conclusion of the Airbnb dispute in New York, the Attorney General’s office gained access to Airbnb listings, and their analysis of those listings was published in a report called “Airbnb in the City” (link). The report says:
the number of unique units booked for private short-term rentals through Airbnb has exploded, rising from 2,652 units in 2010 to 16,483 in just the first five months of 2014.
A survey of New York that I carried out in May 2014 showed a total of 19,006 listings, of which 13,173 had one or more review. The 16,483 number of units with visitors falls in the middle of these numbers, as would be expected (not all visitors leave reviews).
The Attorney General’s report breaks down the listings by room_type:
72% of unique units used as private short-term rentals on Airbnb during the Review Period involved the rental of an “entire/home apartment” for less than 30 days in either (1) a “Class A” multiple dwelling or (2) a non-residential building.
While my data set does not break down rentals by dwelling type, the May 2014 survey of New York shows that 62% of listings with one or more reviews were “Entire Home/Apt” and 86% of all listings were “Entire home/apt”. Again, the Attorney General report’s number is between these two values, as would be expected.
The Attorney General’s report lists the number of hosts:
25,463 hosts offered private short-term rentals in New York City during the Review Period [January 1, 2010 through June 2, 2014].
A survey carried out in November 2013 and a survey carried out in May 2014 showed, when combined, 22,309 distinct hosts who had offered listings on Airbnb. As some will have come and gone during the review period, this number suggests that the surveys are picking up most of the listings in the city.
- Paris
According to Bloomberg (link), Airbnb claimed to have 25,000 listings in Paris in 2014. A survey in September 2014 showed 23,044 and a survey in December showed 24,261.
- Amsterdam
An Airbnb report claimed that “In 2012-2013, Amsterdam’s 2,400 hosts ensured that over 62,000 Airbnb guests”. The first survey I did of Amsterdam, in May 2014, showed 4617 hosts, of which 3228 had at least one review. The numbers reflect a fast growth of Airbnb listings in the city: a year later there are 6,433 hosts, so extrapolating back suggests the survey is in the right ballpark.
- San Francisco
In May 2014, the San Francisco Chronicle carried out their own survey of listings in the city (link). The Chronicle reported “4,798 properties listed in the city. Almost two-thirds — 2,984 — were entire houses or apartments. Of the remainder, 1,651 were private rooms and 163 were shared rooms.”
A survey I carried out in May 2014 showed 6,609 listings in the San Francisco search area. Some of these listings were in areas such as Oakland that are not part of San Francisco proper and which were excluded from their study. Limiting the listings to the city proper (by using GIS data), I find 4,776 listings: almost exactly the same as the Chronicle.
- February 2015 Claims
In February 2015, Airbnb CEO Brian Chesky claimed that “we’ve grown from just 4,000 listings in Paris in 2012 to over 40,000 today.” (link, also the Airbnb statement). A survey I carried out in February 2015 showed 31,385 listings. This is the first occasion in which the number of listings I find is significantly less than a number quoted by Airbnb.
The article also presented (presumably from Airbnb sources) several other data points:
- “More than 90 per cent of hosts in Paris have only one listing”. My survey shows that 93% of hosts have only one listing. (Aside: Paris is unusual in how high this figure is).
- “New York has 34,000 listings”: A survey I carried out in March 2015 showed 28,796, again somewhat lower than Airbnb’s claim.
- “London has 23,000 listings”: My survey from January 2015 showed 21,298 listings, in good agreement.
- “Rio de Janeiro has 18,000 active listings”: My survey from January 2015 showed 13,395 listings.
- “Barcelona has 15,000 listings”: My survey from January 2015 showed 12,496.
In short, the numbers claimed by Airbnb for Paris and New York are the first to show a significant gap between the company’s claims and the data I find from the web site. Given that the occasion of their announcement was to promote the annual Airbnb host event, being held in Paris in 2015, one has to wonder if they were boosting their numbers a little, perhaps by stretching the boundaries that they are considering.
- Conclusions
Although Airbnb rarely makes quantitative statements about the number of listings in particular cities, and when it does make such statements it does not define key terms, matching the survey data against Airbnb’s own data is difficult. There are, however, data points to support the claims that:
- In most cases, there is agreement in total listings (and therefore hosts) between my surveys and Airbnb data of within a few percent. The recent Paris and New York statements are an outlier.
- The distribution of multiple-listing hosts claimed by Airbnb and of room types is well reflected in my surveys.
Estimating visits and income
As mentioned above, the only information related to visits is the number of reviews and the price per night on a listing. Can this information be used to estimate relative incomes and number of visits within a city?
Absolute numbers of visits and incomes are not realistic, but relative numbers of visits would be reliable so long as the ratio of reviews to visits is the same within each group analysed.
In 2013, Airbnb published a report about their business in Berlin (link). It included a listing of the number of guests (= visits) and the hosts’ income grouped by neighbourhood.
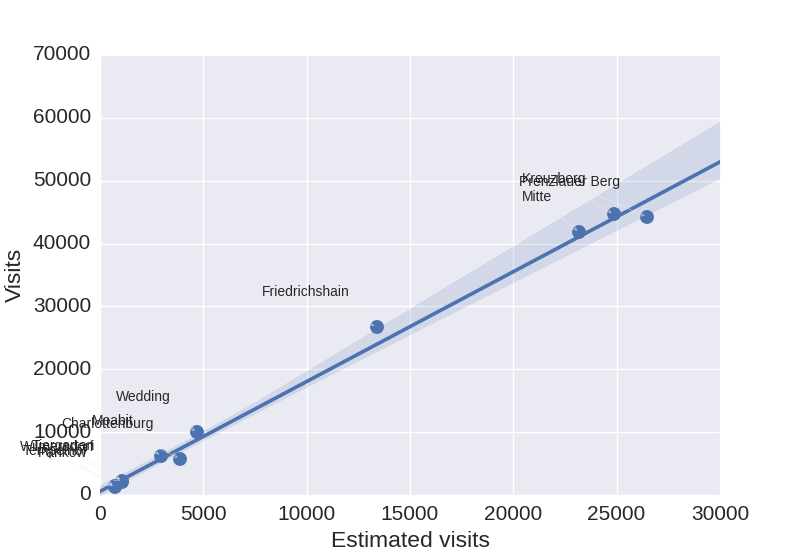
Figure 1
Figure 1 shows the aggregated number of reviews per neighborhood (based on reported neighborhood from the Airbnb listing pages) on the x-axis, and the total number of guests as reported by Airbnb on the y-axis. The relative number of visits as estimated by this method provides a good foundation for policy and social impact discussions.
According to the Figure, the number of reviews is 55% of the number of guests reported by Airbnb (which is presumably greater than the number of bookings, as each visit may include multiple people).

Figure 2
Figure 2 takes the estimation one step further. If the average length of a visit is the same between groups, then the product of the number of reviews and the per-night price should give a good relative picture of the incomes within groups. In this case, the data is grouped by neighborhood within Berlin.
The figure shows that the estimated income is proportional to the reported absolute income to sufficient accuracy to be used for public policy and social impact discussions. Absolute “income” estimates are, of course, meaningless.
Conclusion
For all its flaws, the data collected by scraping the Airbnb web site for individual cities is reliable enough for policy and social impact discussions.
Footnotes:
1 My thanks to Murray Cox for discussion of this point.
Hi. I skimmed your article here and it looks like your code does exactly what I’m looking for. However….. I don’t have python or SAP readily available to me. I’m looking to do anything complex really. I just want to find out how many airbnb reviews per listing exist for a particular city (plus coordinates). I’m a GIS Analyst and I would like to create a map or two depicting these listings stylized by the number of reviews. The more reviews, the larger the dot. That would show not only where the listings are, but how popular are the listings.
So do you know of a way, or code, to scrape this information and create a .csv file if nothing else?
Thanks
Hi, I have noticed that your airbnb code is no longer on github. Would you care to share it privately? Thanks in advance!
Yes. There are a few reasons. Mainly, Airbnb is getting more aggressive about blocking scrapes — my home IP has been blocked from the site for weeks now – so posting things on GitHub seemed maybe too friendly. So send me an email at tom at tomslee.net but you should know that this kind of work may not be possible for much longer without a lot more skills than I have.
Hi, Tom. Could you share the python code with me? I would highly appreciate it!
I am a graduate student. Would you mind share your airbnb code for educational using? Very appreciate your sharing!
Hi Tom! I was wondering if you have any current or historical breakdown data of how many listings (either globally or for a city like San Francisco or NYC) are for rooms only vs entire houses/apartments.
I would also love to have the python code since the sourceforge link doesn’t work anymore.
Thanks a lot for the super interesting work and accessibility to it!
Cheers,
Cary
Hi, We are doing research on Airbnb and the problem ‘multilisting’ investors cause on the housing market. Could you share your scraper code? Thanks!
Hi Tom, would you be willing to share your data collection source code for an Airbnb research project? I have a very basic understanding of python and web scraping in general, but your documentation is very thorough and I think I may be able to make it work.
Best,
Ania
Hi Tom, I am putting together a study on Airbnb in Prague/the Czech Republic. It seems that you have a great data database for this purpose. Would it be possible to share your source code, so I could use your data for this research paper. Thank you very much!
Hello Tom,
I am interested in testing out some basic economic impact analysis on STRs and I would like to get ahold of your source code and data you have collected!
Thank you